What to post when your account stops growing
A four-week plan that starts from your own best posts, the questions in your comments and the hours your followers are online.
On this page
More of what already worked for your own followers, in the format that brought the most follows, at the hours those followers are online. Start from your best posts of the last three months, the questions people asked under them and the times your followers open the app, then run the plan below for four weeks before you judge it.
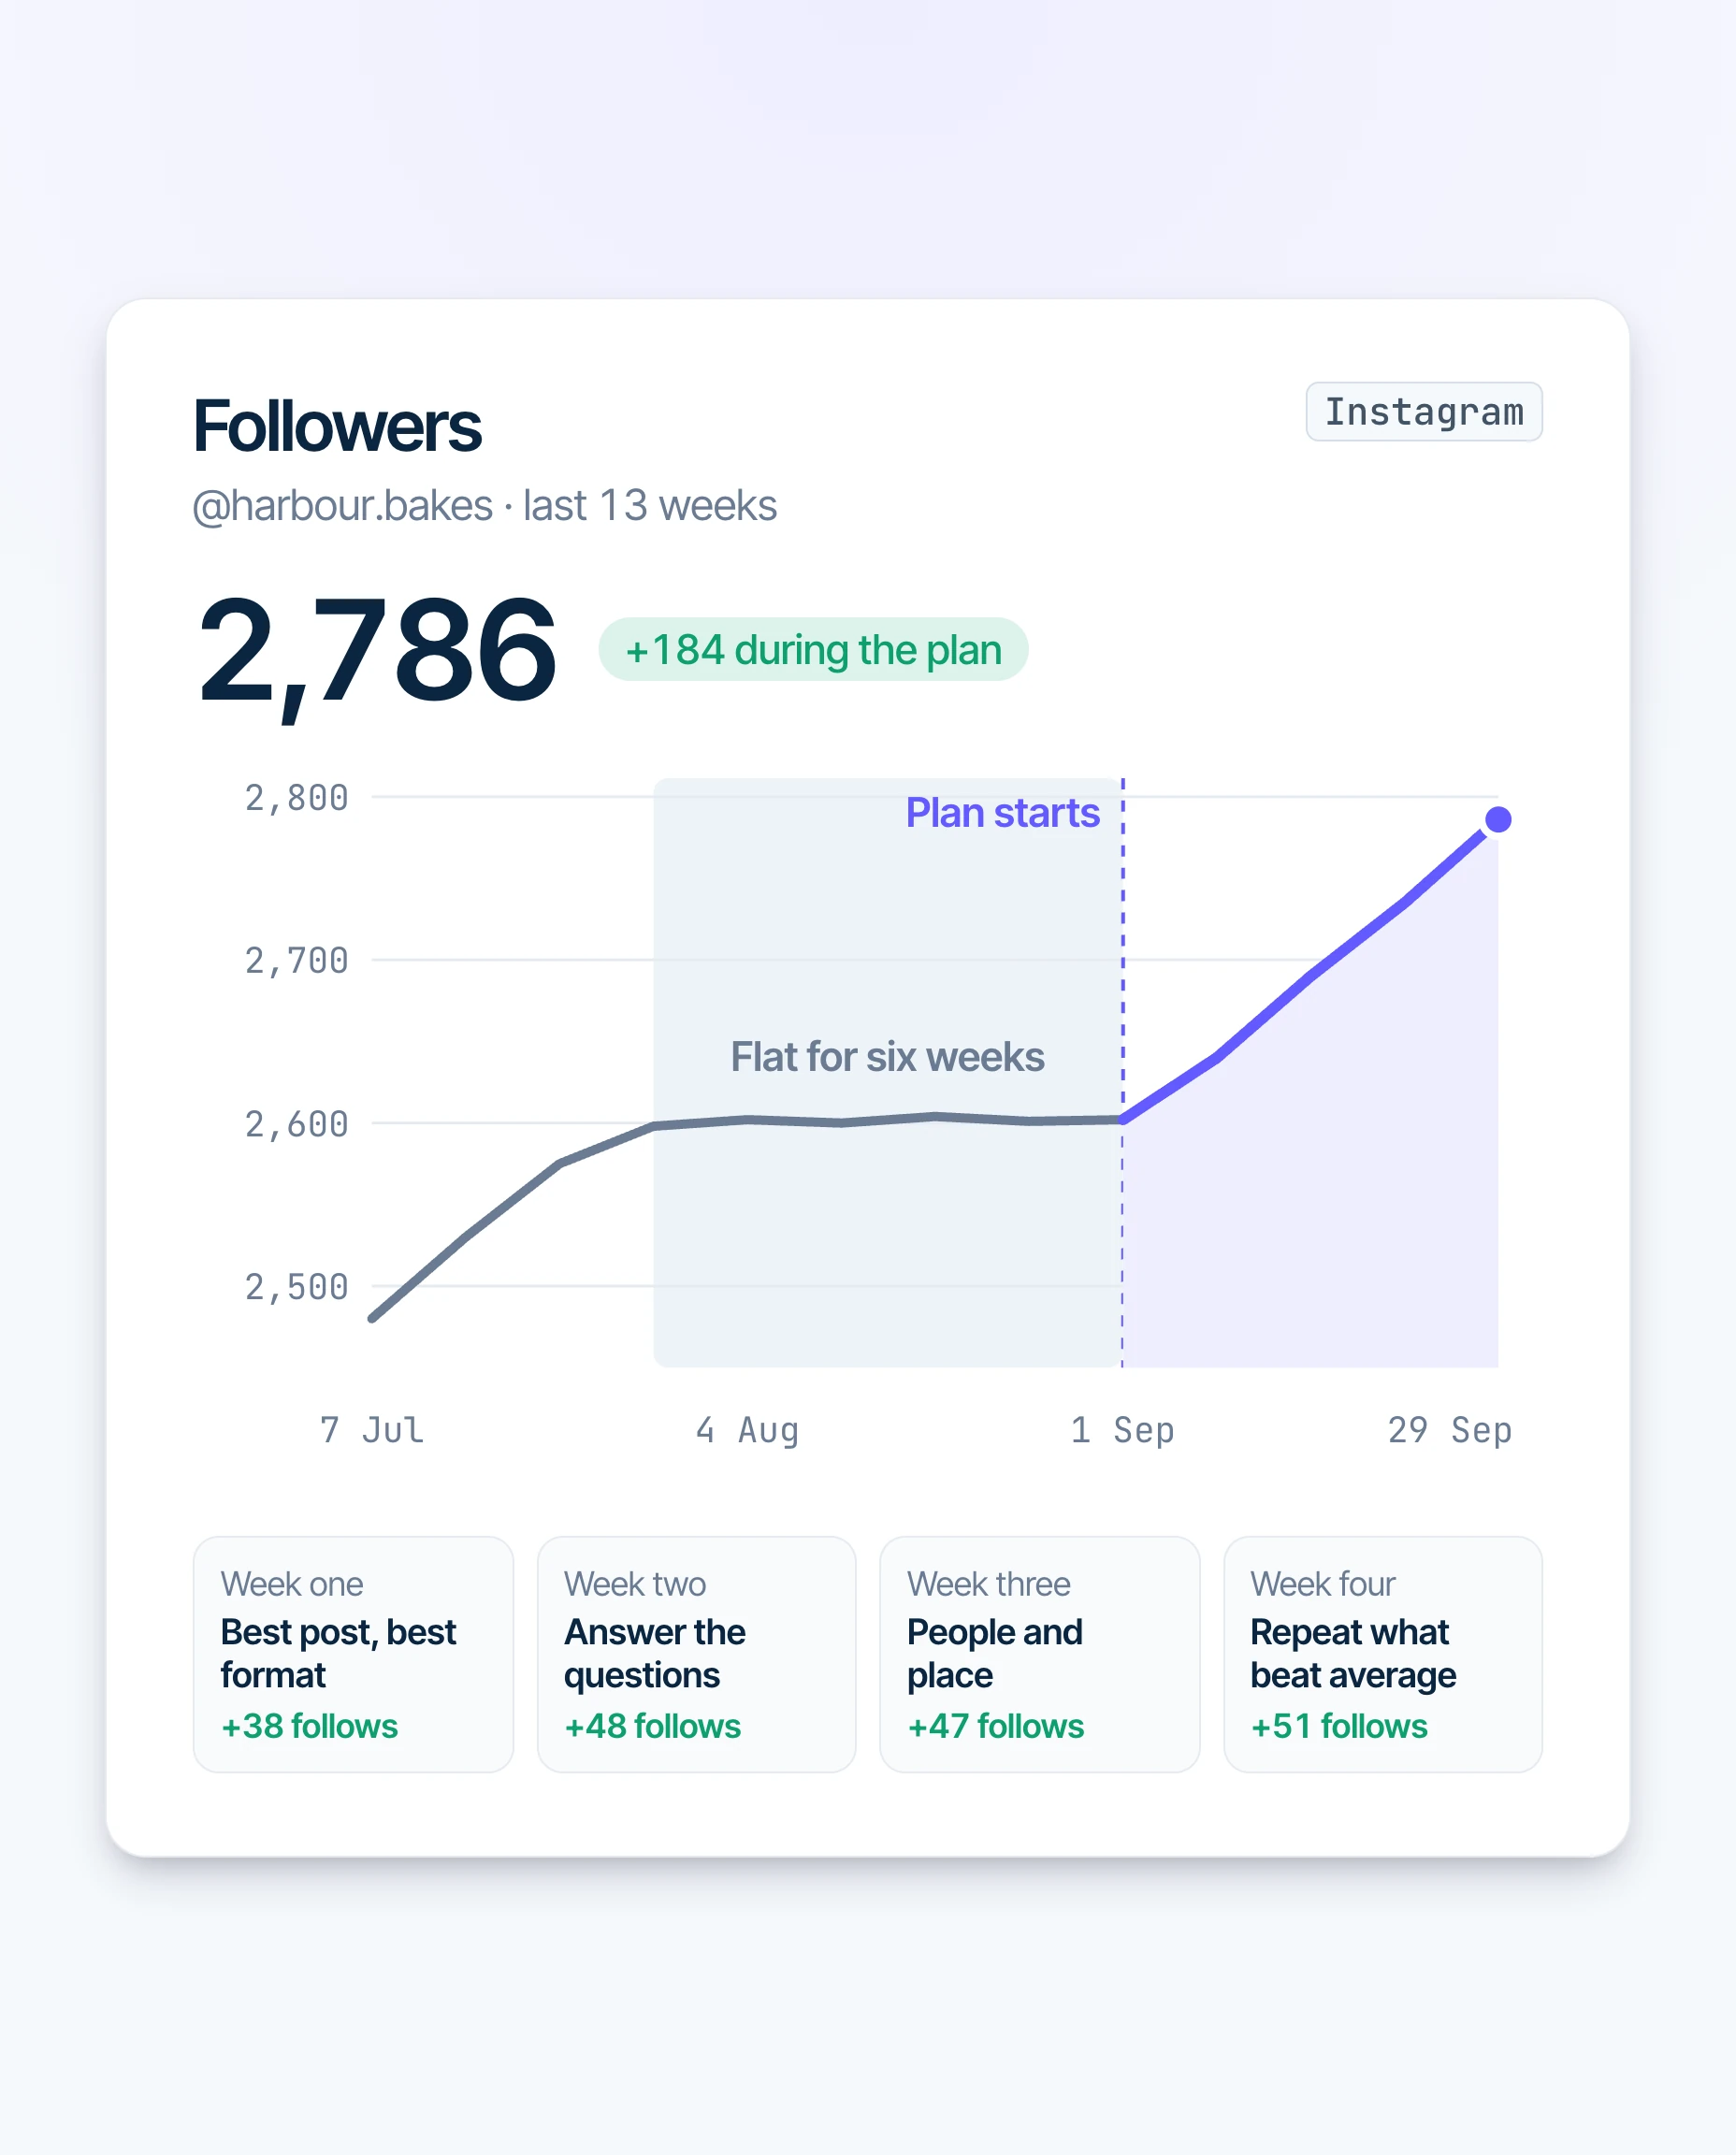
An account that stops growing has not stopped working. Its posts still reach people; fewer of those people choose to follow. The answer is rarely a new look, a new posting tool or more posts. It is a closer reading of the posts that earned follows before, and a month of posts built from them.
This guide covers four things: how to tell a stall from a slow week, what to read in your own numbers, a plan for the next four weeks, and how to check whether the plan worked. Everything runs on data your account already has, so you can start today.
A stall or a slow week?
- DefinitionStalled account
- An account whose follower count has stayed flat or fallen for at least four weeks while it kept posting on its usual schedule. A flat week after a holiday, or after a break from posting, is not a stall.
Followers rise and fall a little every week. People unfollow when a sale ends, when a season changes or when they move away, and new people find you through a share or a search. A single flat week says very little. Four flat weeks of regular posting say something has changed: the posts reach people who find no reason to follow.
Before you change anything, write down three facts about the last three months: how often you posted, which formats you used, and at what time of day the posts went up. You will need them later to see what the plan changed, and they often show the cause on their own. An account that moved from Reels to single photos, or from evening posts to early mornings, has a likely answer before it opens a single chart.
Read the last three months
Open your insights and set the range to the last 90 days.1 Instagram shows trends across your followers, including the hours they are most active, once the account has at least 100 followers.1 Three readings matter, and the table below says what each one tells you.
| Reading | What to look at | What it tells you |
|---|---|---|
| Best posts | The posts that brought the most follows, not the most likes | Which subjects and formats turn a viewer into a follower |
| Questions | The comments and DMs that ask something | What followers want next, in their own words |
| Timing | The hours your followers are most active, next to the hours you posted | Whether your posts go up while your followers are away |
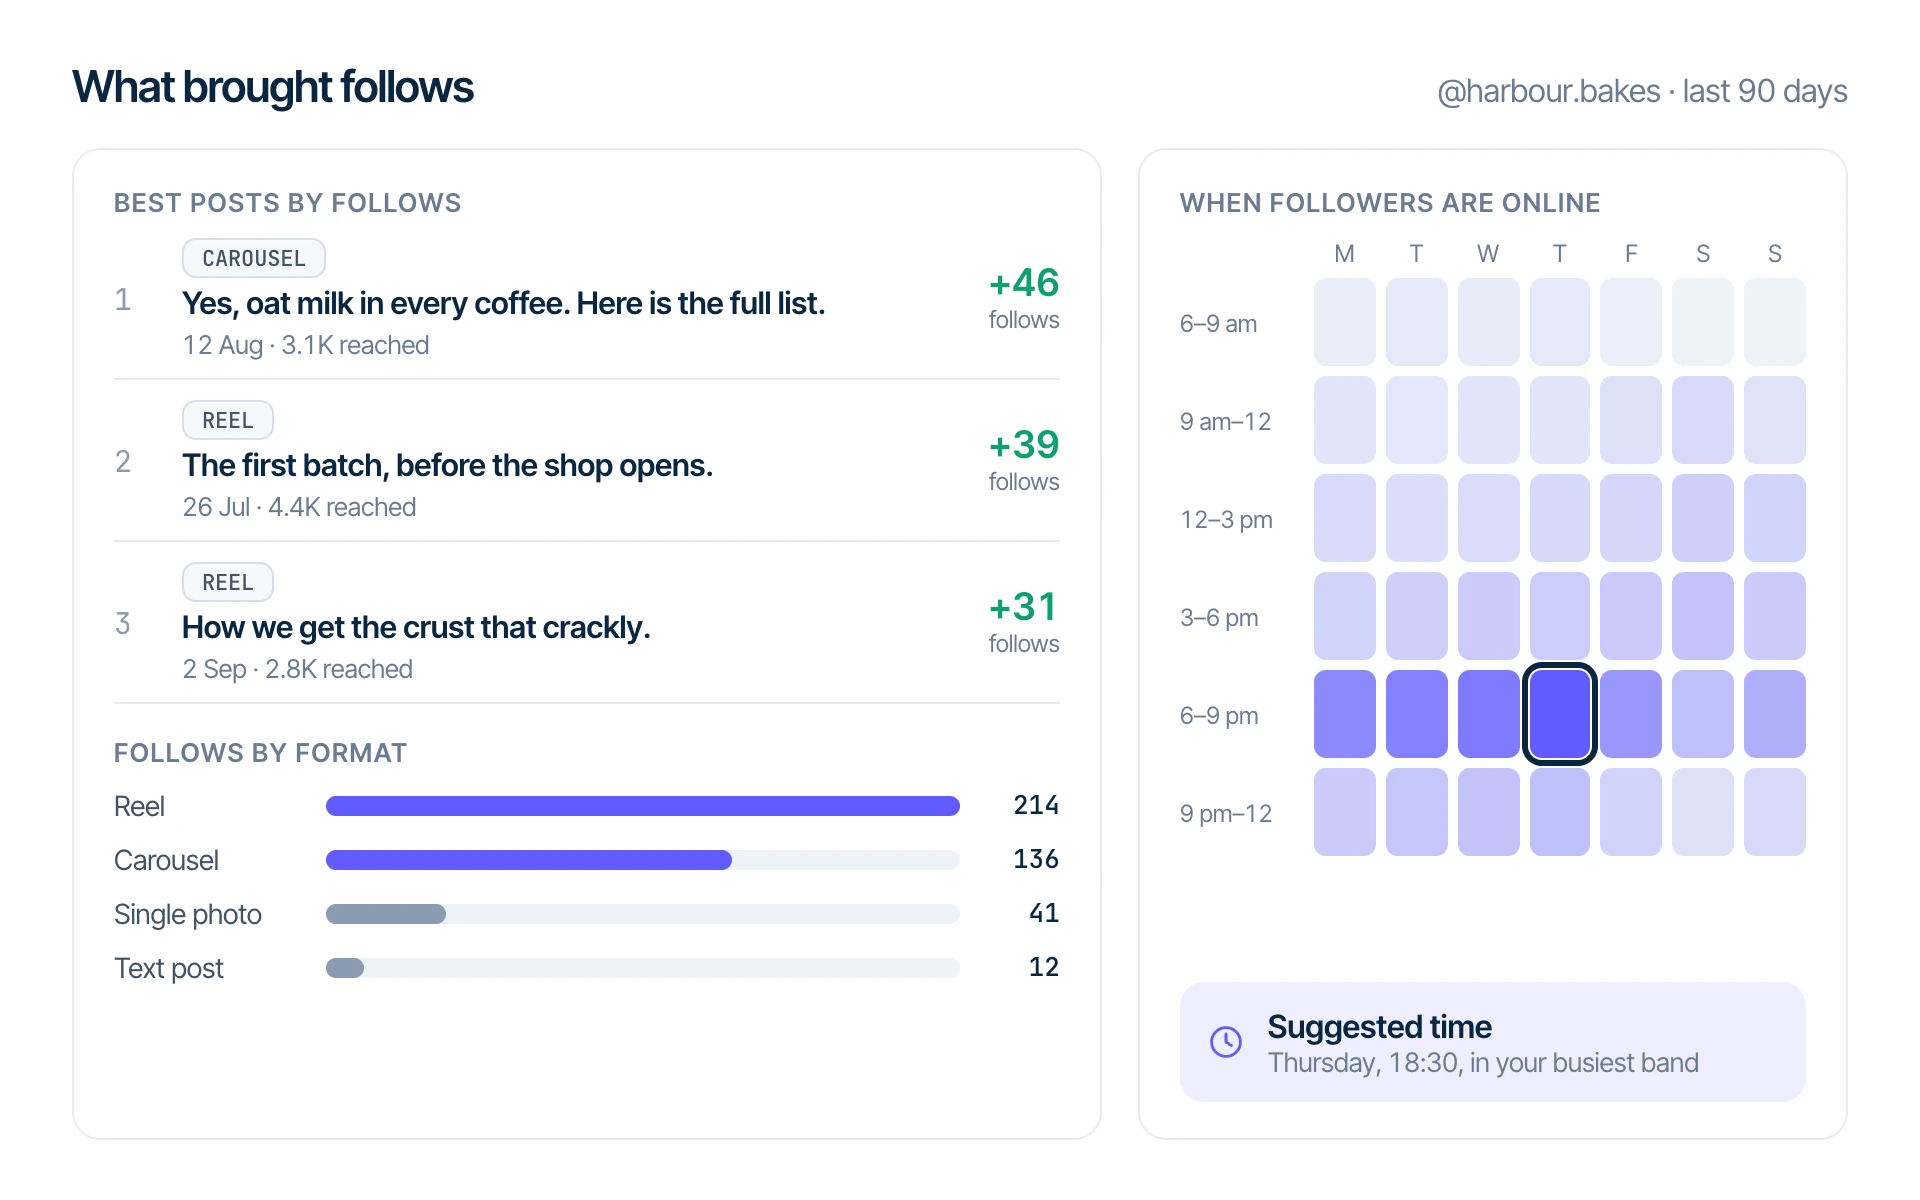
Follows per post matter more than likes here. A post with many likes from people who already follow you keeps them happy; a post that brings new follows tells you what strangers want from you. Sort your posts by follows if your insights show them, or by reach if they do not, and note the top three. Look at what they have in common: the subject, the format, the first line, the day.
Then look at the formats across all your posts. A split like the one below is common enough to check for: one or two formats bring most of the follows, while the rest keep existing followers busy.
In this example, Reels and carousels brought most of the follows. That does not make single photos worthless: they keep regular followers in touch and they are quick to make. It means the plan should lean on the two formats that bring new people, and keep the others for the days in between.
Find the hours your followers are online
The same insights screen lists the days and hours your followers are most active.1 Put your posting times next to them. A common gap: posts go up at the hour that suits the person posting, early in the morning or late at night, while the followers are online in the evening. Check whether that gap is yours before you change anything else, because it costs nothing to fix. The Best Time to Post tool lays the hours from your insights out as a weekly grid in your own time zone.
Plan the four weeks so most posts go up in the darkest band of your own grid. Keep one post a week in a lighter band as a test. If it does as well as the others, you have found a second window and more room in the week.
The four-week plan
Each week has one job. Post as often as you did before the stall: the plan changes what you post and when, not how much. Posting more of what stopped working adds hours to your week and rarely adds follows.
- Week oneRemake your best subject in your best format
Take the subject of your best post and make it again in the format that brought the most follows. A photo that did well becomes a Reel or a carousel. Keep the first line close to the original, because that line already worked.
- Week twoAnswer the questions
Turn the questions from your comments and DMs into posts, one question per post, with the follower's words in the first line.
- Week threeShow the people and the place
Post the work behind the result: who does it, where, in what order and how long it takes. Followers come back for the people as much as for the product.
- Week fourRepeat what beat your average
Look back at weeks one to three. Make two more posts in the subject and format that beat your own average, and drop the one that came last.
Week one in practice: a café whose best post of the season was a photo of a flat white turns it into a carousel. The question from the comments goes in the first line, the answer on the first slide, and the rest of the coffee list on the slides after it.

harbour.bakesYes, oat milk in every coffee. Here is the full list, and the one we drink ourselves.
The photo carries no text. The answer sits in the caption's first line, where people read it before they decide to open the post, and where Instagram search can read it too.
Week three is the one most accounts skip, because the work behind the result feels ordinary to the people doing it. It rarely feels ordinary to followers. A clinic's sterilising routine, a bakery's first batch before sunrise and a studio's room before the first class all answer the question a new visitor has before they book: who are these people, and can I trust them?
Check the result after four weeks
Give the plan the full four weeks. A single week moves with the weather, the news and the school holidays. After four weeks, compare the month with the three months before it on the same measures: follows per post, reach per post and engagement rate per post.
Engagement rate by followers is the quickest single check for each post: add the likes, comments, shares and saves, and divide by your followers. Work it out for every post of the four weeks and compare it with your own average from the months before.2 The calculator below runs in your browser; the full Engagement Rate Calculator also works it out by reach.
On the general guide many marketers use, under 1% is low, 1 to 3% is average for a business account, 3 to 6% is high and 6% or more is very high.2 Your own average matters more than the bands. A post at 2% on an account that usually sits at 1.2% is a post to make again, in a new format, next month.
If the month beat the months before, keep the plan's posting hours and its best format, and run it again with new subjects. If it did not, look at the week that came closest and start the next month from that week's job.
Where ProfileScan fits
ProfileScan reads your own account: the posts that brought follows, the questions in your comments and DMs, and the hours your followers are online. Its Ideas screen turns them into the week's posts, each with the reason it was picked and a suggested time. Nothing is posted until you approve it.
The plan on one page
Questions
How long before I see a change?
Should I post more often to restart growth?
What if my best posts are all old?
Do I need new hashtags?
- Instagram Help Center: About Instagram insights, follower trends, most active times, the follower threshold and the preset time ranges
- ProfileScan Engagement Rate Calculator, the engagement rate bands used in this guide